Creating a Brain using Nengo: an Introduction
Do you ever think of creating an artificial brain back then at elementary school as a cool science project?

Introducing Nengo (Bekolay et al., 2014), a Python tool for building large-scale functional brain models. Nengo was created to simulate a large-scale brain using Neural Engineering Framework (NEF; Eliasmith and Anderson, 2003).
In the publication, it was mentioned that Nengo and the NEF has been used to build sophisticated neural subsystems for last decade research, e.g., path integration (Conklin and Eliasmith, 2005), working memory (Singh and Eliasmith, 2006), list memory (Choo and Eliasmith, 2010), inductive reasoning (Rasmussen and Eliasmith, 2014), motor control (DeWolf and Eliasmith, 2011), decision making (Stewart et al., 2012), and recently with Spaun, the world’s largest functional brain model (Eliasmith et al., 2012).
Example
As there will be a long path to create a brain, Nengo has several examples for simple neural programming tasks. For introduction, we will use the simple, but not the simplest example.
Nengo runs on Python and it has GUI. You can install Nengo using pip.
pip install nengo nengo-guiMany Neurons
This demo shows how to construct and manipulate a population of neurons. Suppose that we will create 100 leaky integrate-and-fire (LIF) neurons with randomly-selected tuning properties. The input is a sine wave, showing the effects of increasing and decreasing input.
These are 100 leaky integrate-and-fire (LIF) neurons. The neuron tuning properties have been randomly selected. As a population, these neurons do a good job of representing a single scalar value. This can be seen that the input graph and neurons graphs match well.
%matplotlib inline
import matplotlib.pyplot as plt
import numpy as npimport nengo
from nengo.utils.ensemble import sorted_neurons
from nengo.utils.matplotlib import rasterplot
First, we create our neural populations. Our model consists of a single population of neurons, in 1 dimension.
model = nengo.Network(label="Neurons")
with model:
    A = nengo.Ensemble(100, dimensions=1)
Then, we will use sine function as continuously changed input.
with model:
    sin = nengo.Node(lambda t: np.sin(8 * t))
After that, we connect the input to the neurons population.
with model:
    nengo.Connection(sin, A, synapse=0.01)
Finally, we collect the output. In this part, we collect the spikes produced. We will probe the output every 10 ms and run the simulation for 1 second.
with model:
    sin_probe = nengo.Probe(sin)
    A_probe = nengo.Probe(A, synapse=0.01)
    A_spikes = nengo.Probe(A.neurons)  with nengo.Simulator(model) as sim:
    sim.run(1)
We can visualize the neurons activity by looking at the spiking graph.
# Plot the decoded output of the ensemble
plt.figure()
plt.plot(sim.trange(), sim.data[A_probe], label="A output")
plt.plot(sim.trange(), sim.data[sin_probe], "r", label="Input")
plt.legend()

# Plot the spiking output of the ensemble
plt.figure()
rasterplot(sim.trange(), sim.data[A_spikes])
plt.xlim(0, 1)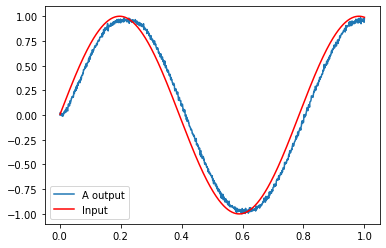
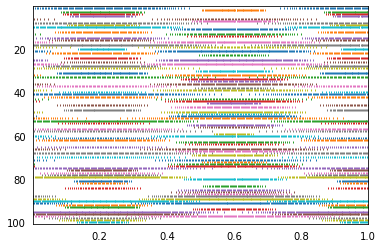
The upper graph shows the response of neurons given the input. The spiking activity showed by the dense line in the bottom graph.
Thats the first part of simulation, I wish to write more complex experiments later, involving the GUI.
References
https://github.com/nengo/nengo
About the Author
Salman is the Chief Data Officer at Allure AI, an emerging beauty-tech startup in Indonesia. He graduated from Astronomy and Astrophysics studies at Institut Teknologi Bandung with a brief summer school at Princeton University. He is an avid reader, mountaineer, and developing interests in astronomy and computational neuroscience. Previously, he had a residency as artificial intelligence engineer in Konvergen AI, software engineer at Chatbiz.id, and had a research assistantship in the astronomy department, as well as assisting various courses in astronomy, computational science, and management department.